Blog
CMME Final Exhibit Component
For the Creating Museum Media for Everyone (CMME) project, the team from the Museum of Science, Boston, aimed to develop a proof-of-concept exhibit component that used multisensory options to display data and whose components could be adapted into a basic toolkit for use by other museums. The development of this exhibit was kicked off with two back-to-back workshops featuring talks by experts in the field and working sessions to explore some possible directions for an accessible digital interactive. This post gives an overview of the final exhibit component and reviews the goals and constraints of the project.
Video tour of the exhibit (closed captions available in the "CC" option along the bottom edge of the video window):
If you are unable to watch the video, scroll down for text and image descriptions of the exhibit.
Goals and constraints:
Although the project included exploring many different technological paths, there were goals for both the overall project as well as the specific exhibit component. The project aimed to create shareable results that would help others in the museum field create more accessible digital interactives that could support data interpretation.
Project goals:
- To further the science museum field’s understanding of ways to research, develop, and evaluate inclusive digital interactives
- To develop a universally designed computer-based multi-sensory interactive that allows visitors to explore [and manipulate]* data
- To develop an open-source software framework [allowing the design of the full interactive to be adapted to fit any institution]*
- To provide an exemplar that will allow other museums to represent data sets as universally accessible scatterplot [or bar]* graphs
*Bracketed portions of the project goals were explored, but are not reflected in the final exhibit component installed on the Museum floor. Code for programming these tasks was developed and will be released in an open source toolkit later this fall for institutions to explore.
Exhibit goals:
- Visitors will understand abstract wind turbine data through multi-sensory interaction and interpretation
- Visitors will improve their data analysis skills to learn about wind turbine technology
- Visitors will view themselves as science learners through their interaction with and manipulation of wind turbine data
Final exhibit component:
We revised an existing component in the Museum of Science’s Catching the Wind exhibition, which allows a broad range of visitors to explore power production data from wind turbines mounted on the Museum roof. Below are text descriptions and pictures of the exhibit that match the content in the walkthrough video above:
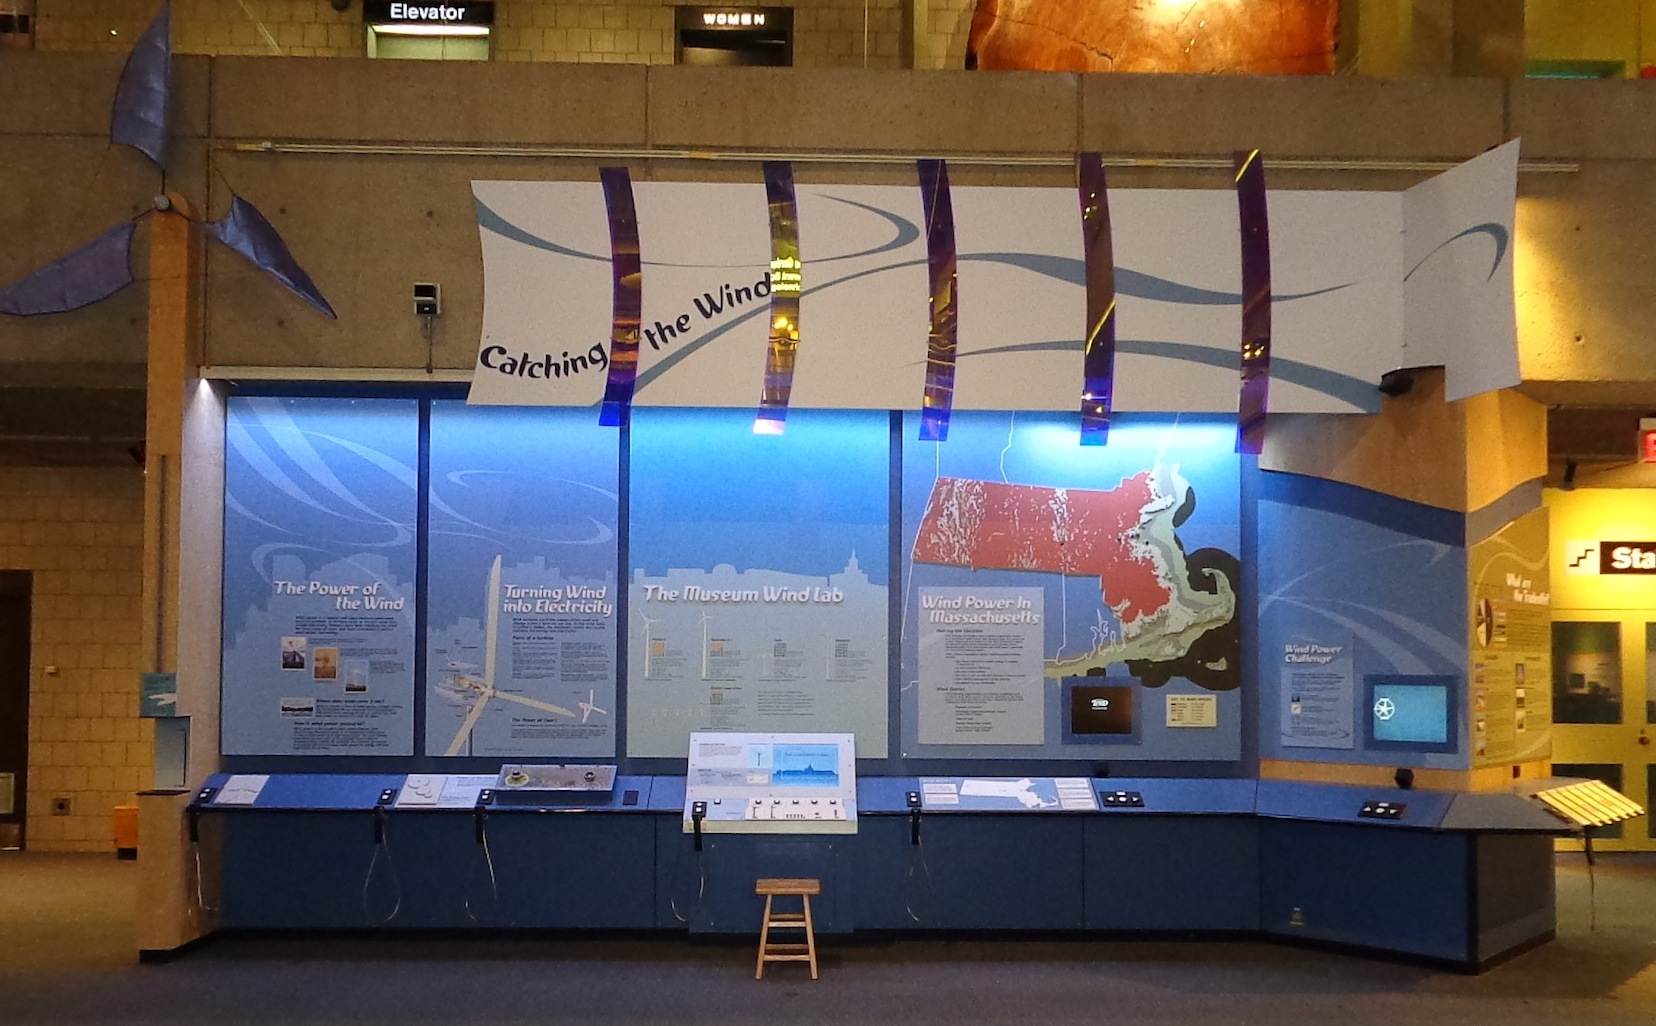
Catching the Wind exhibition
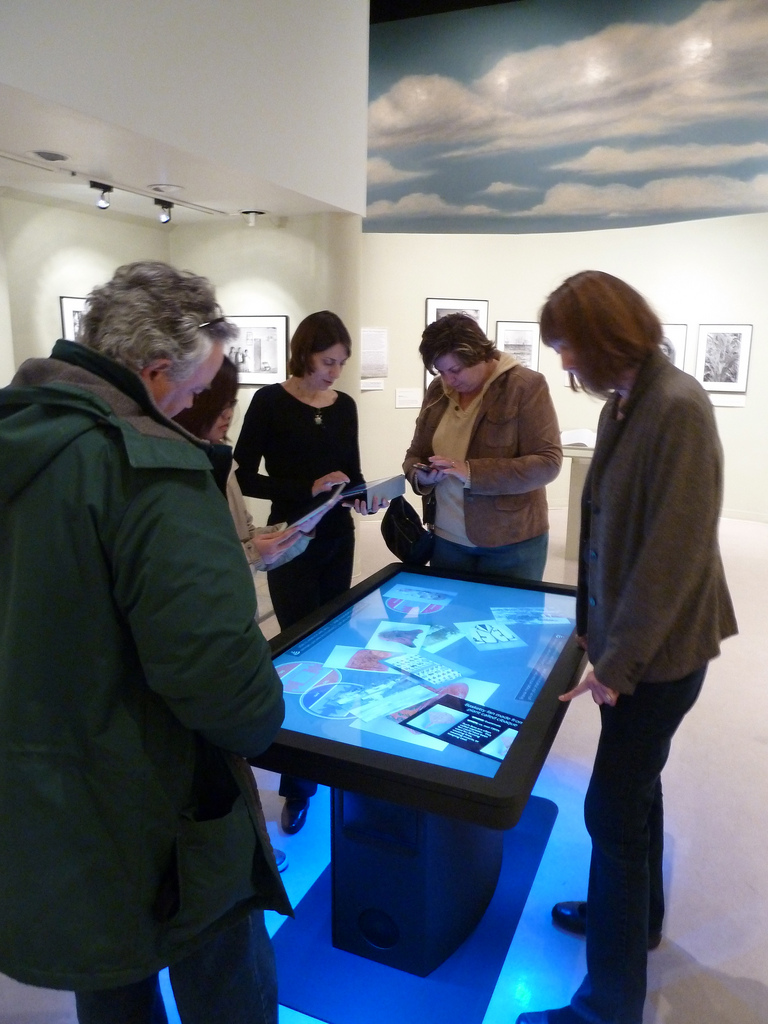
The final exhibit component is part of a larger 25-foot long exhibition extending to the left and right. The component includes an informational label and a touch screen computer activity. The 4-foot wide computer interactive contains auditory and visual graphs showing power production of wind turbines mounted on the Museum's roof.
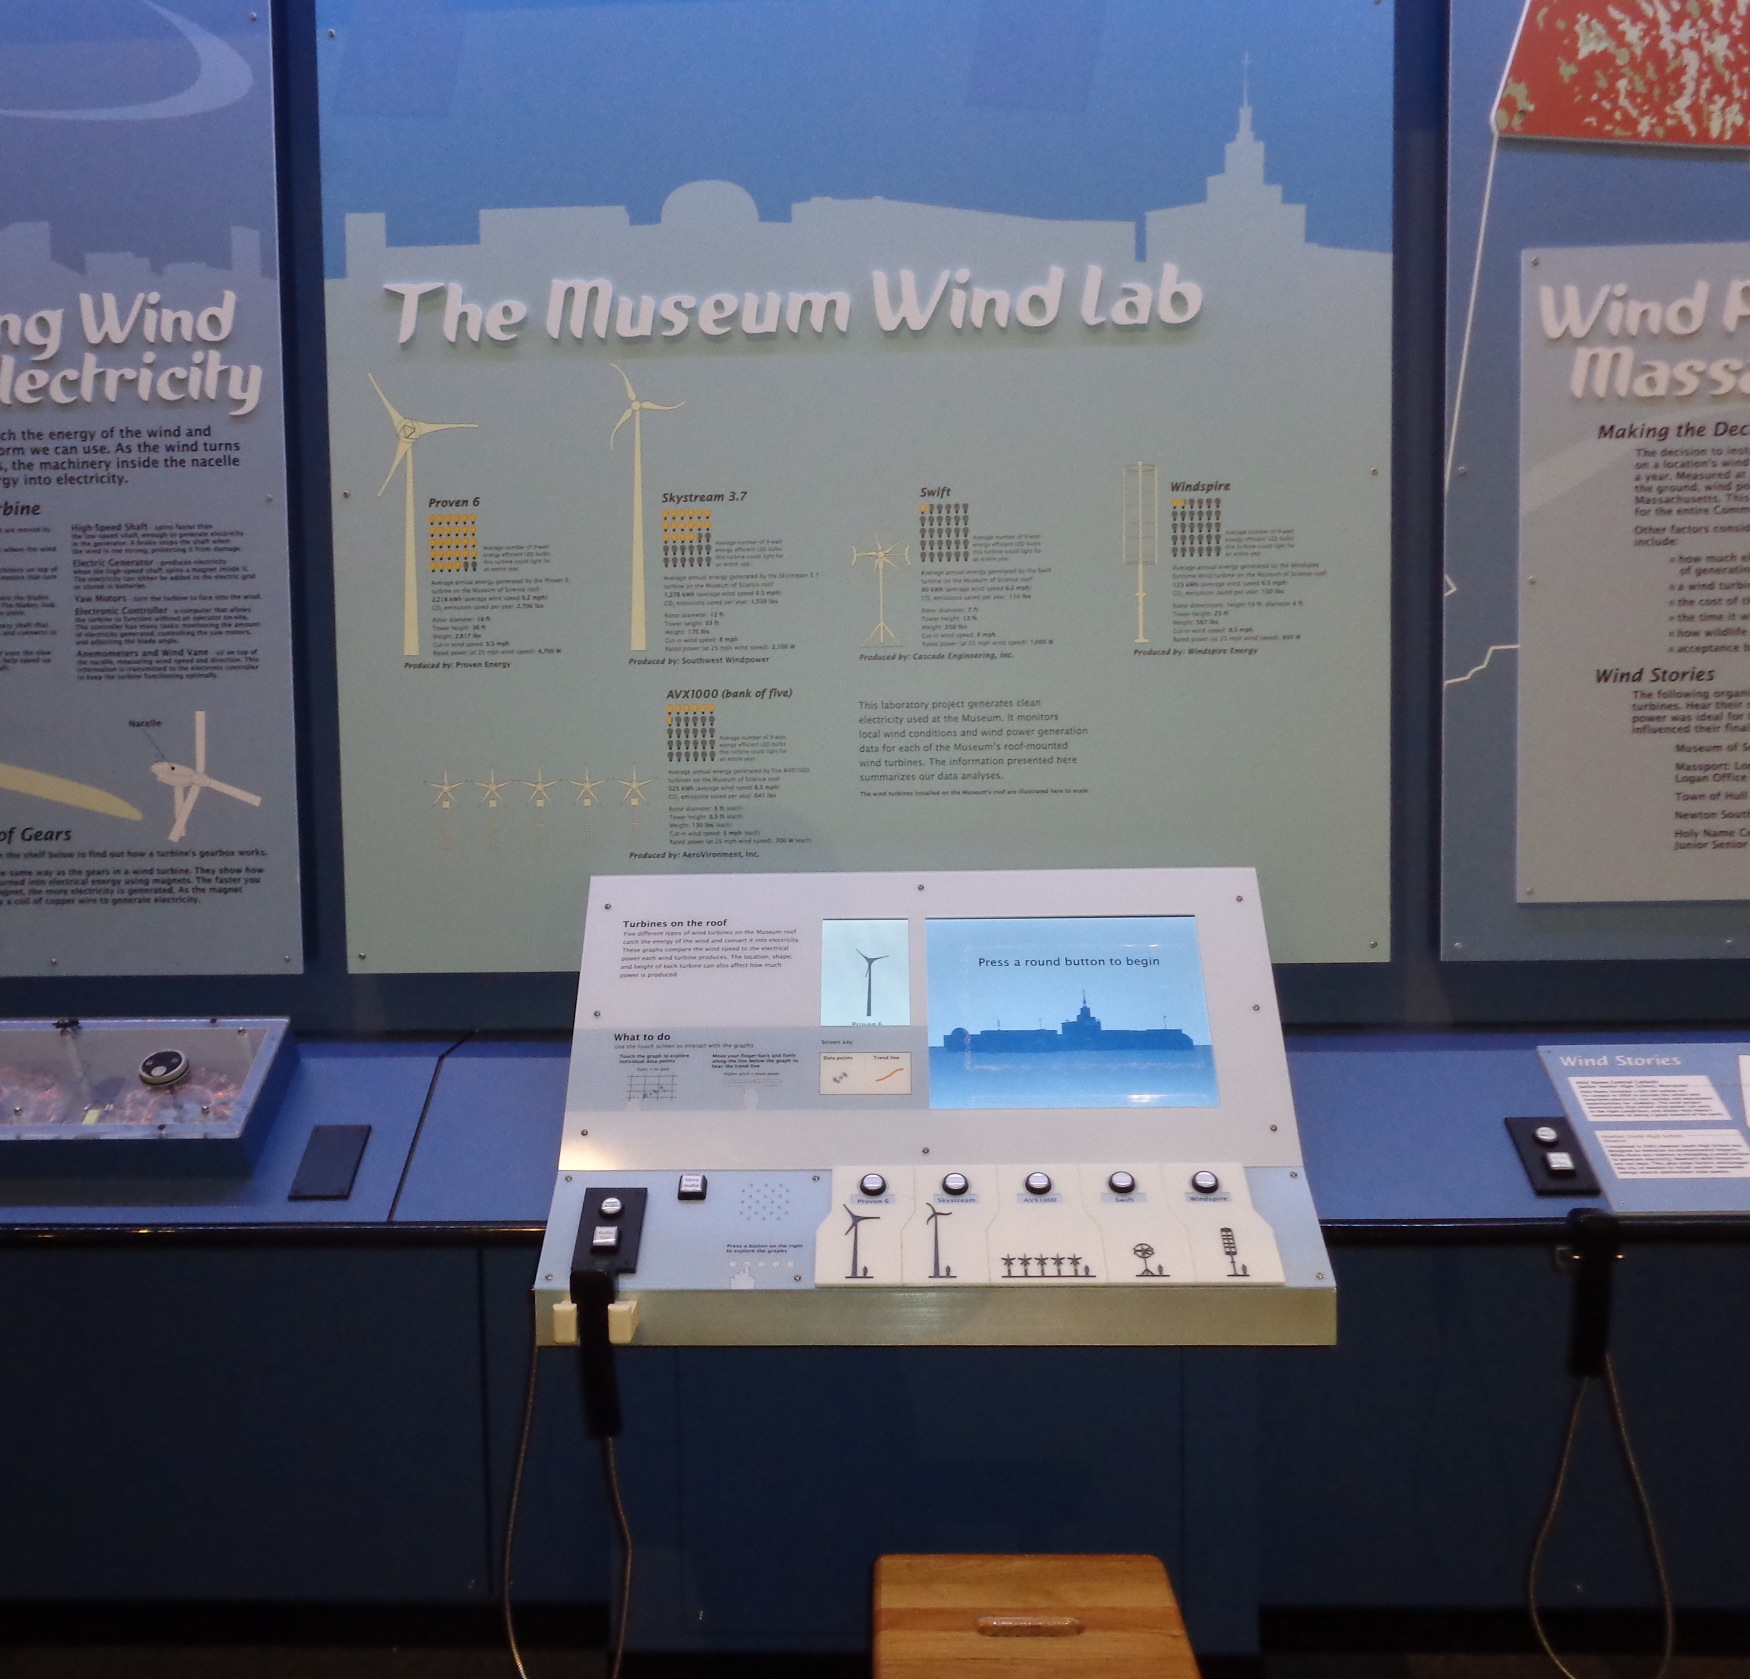
CMME exhibit component
There is a large printed label above the computer screen with images and statistics for each turbine type. The lower left side of the exhibit has an audio phone handset with two buttons. The square “Audio Text” button gives a physical description of the exhibit component. The round “Next Audio” button walks a visitor through the printed imagery and text on the labels.
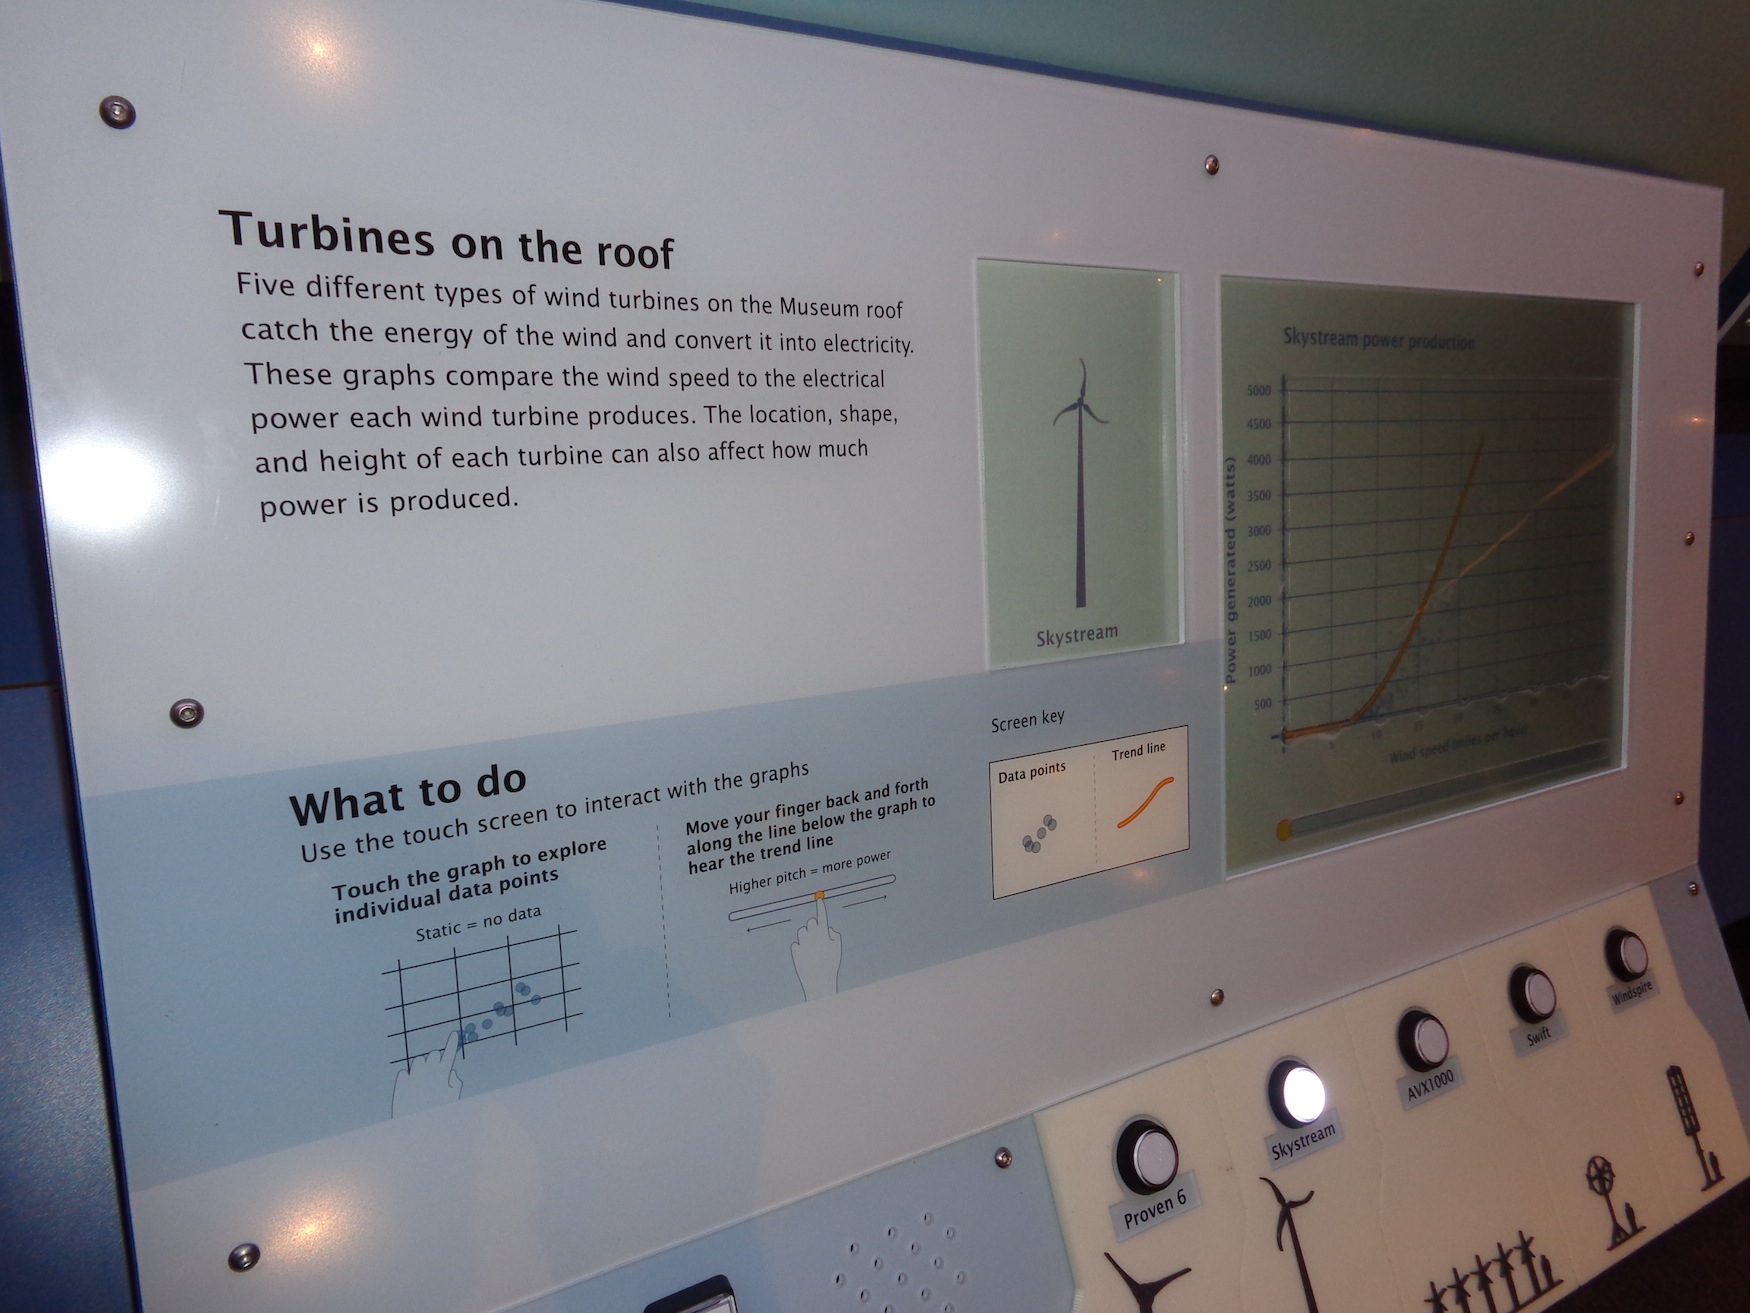
Slanted panel label and touch screen
The slanted panel along the front of the exhibit contains a touch screen, a small introductory label with simplified instructions, a square “More Audio” button which plays a detailed broadcast audio introduction to the graph, and five round buttons with corresponding high-contrast tactile versions of the turbines. A tactile adult person is used for scale next to each turbine.
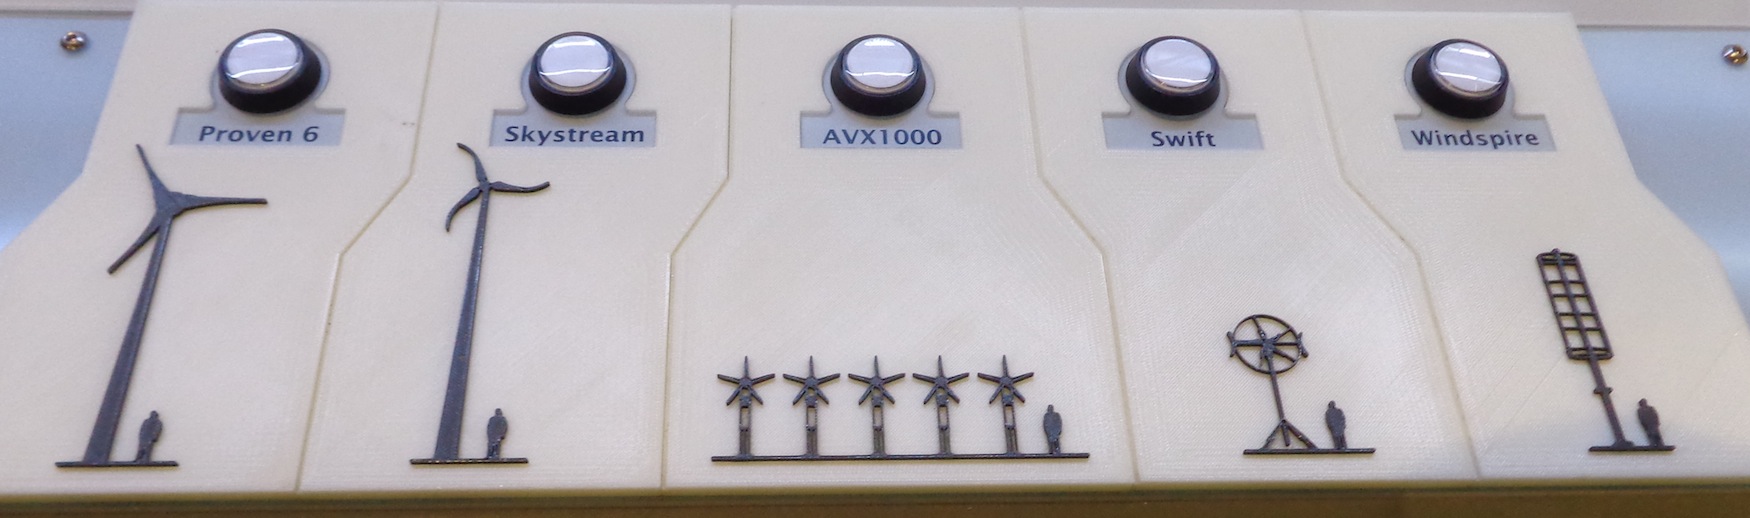
Buttons and high-contrast tactile scale versions of the wind turbines
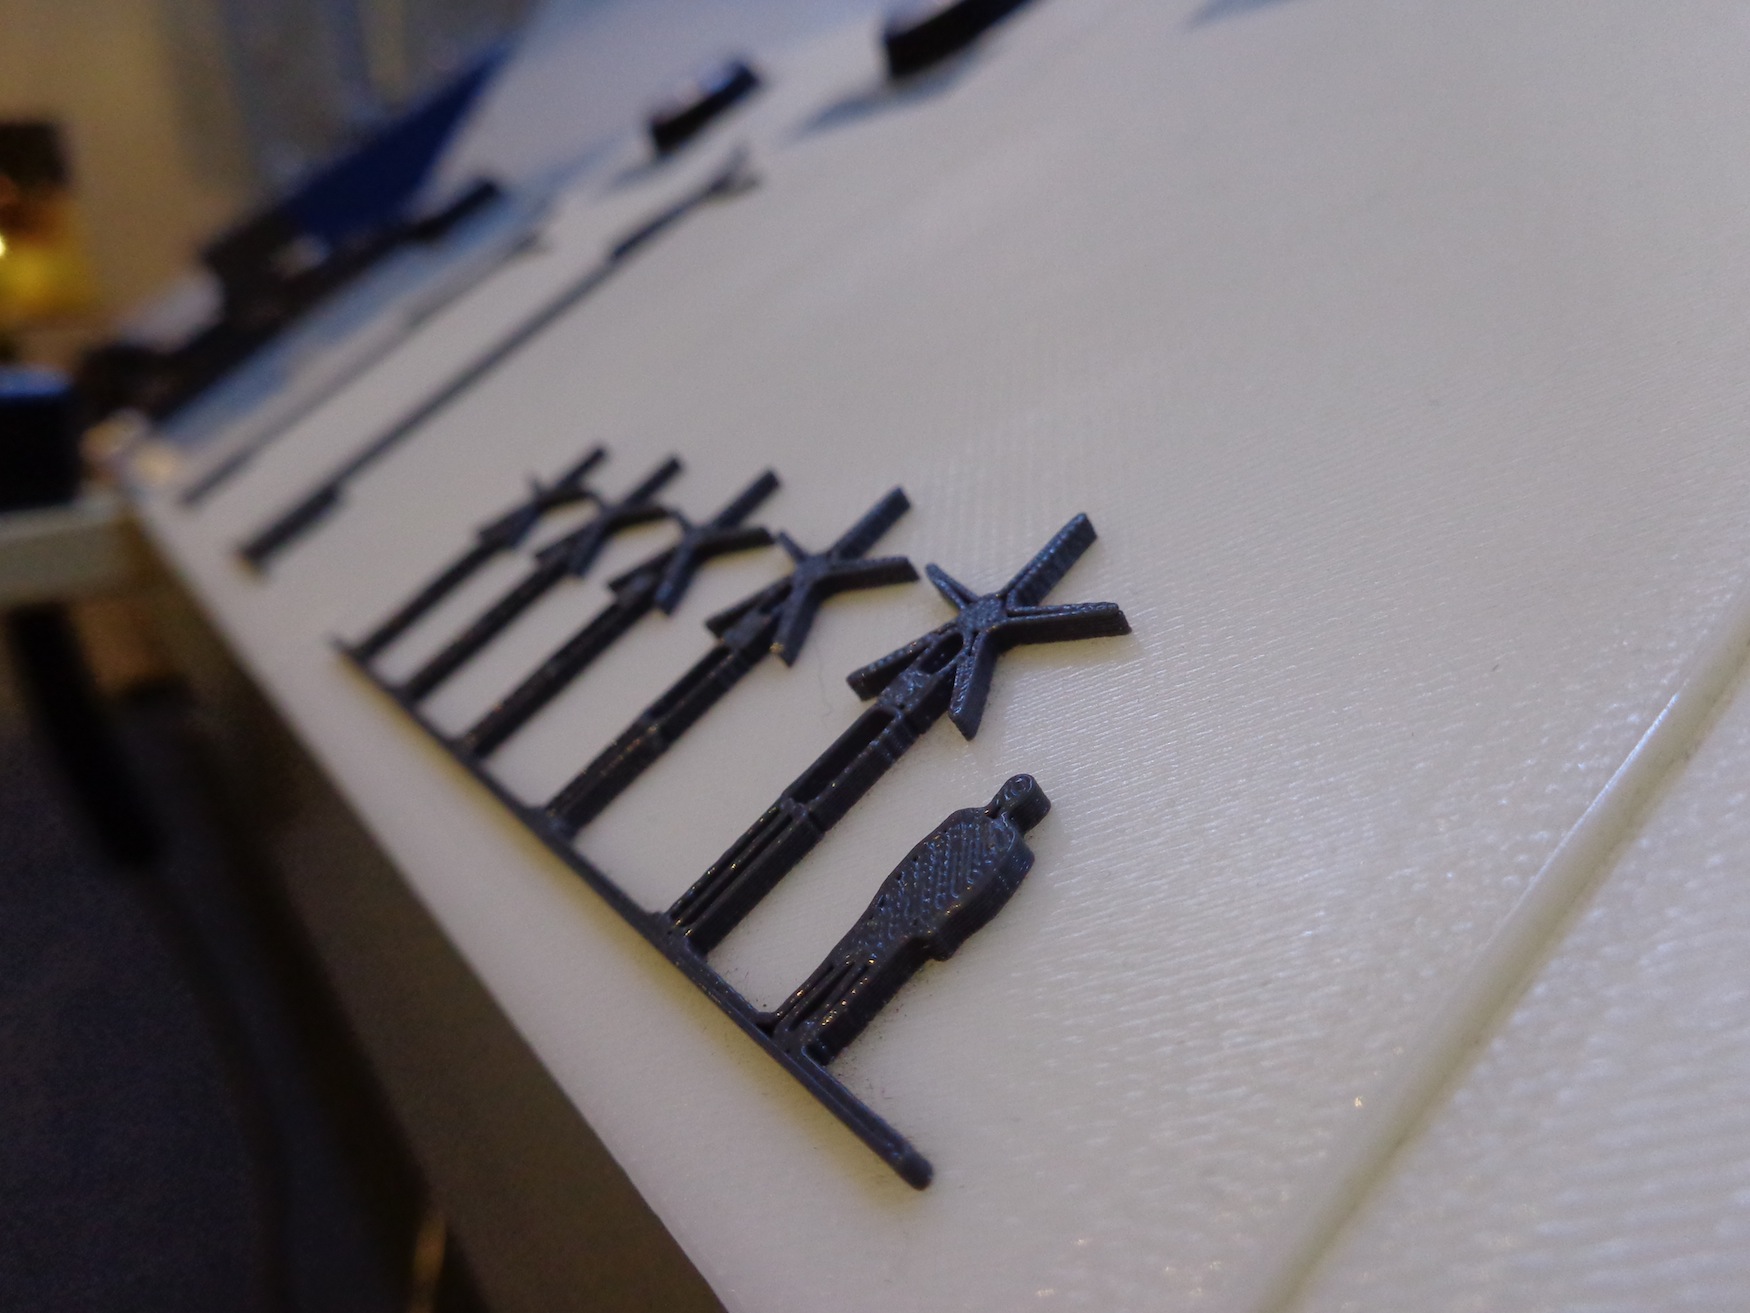
Close-up of high-contrast tactile scale versions of the wind turbines
When idle, the large touch screen shows text prompting visitors to “press a round button to begin.” Audio also articulates this prompt when the screen is touched.
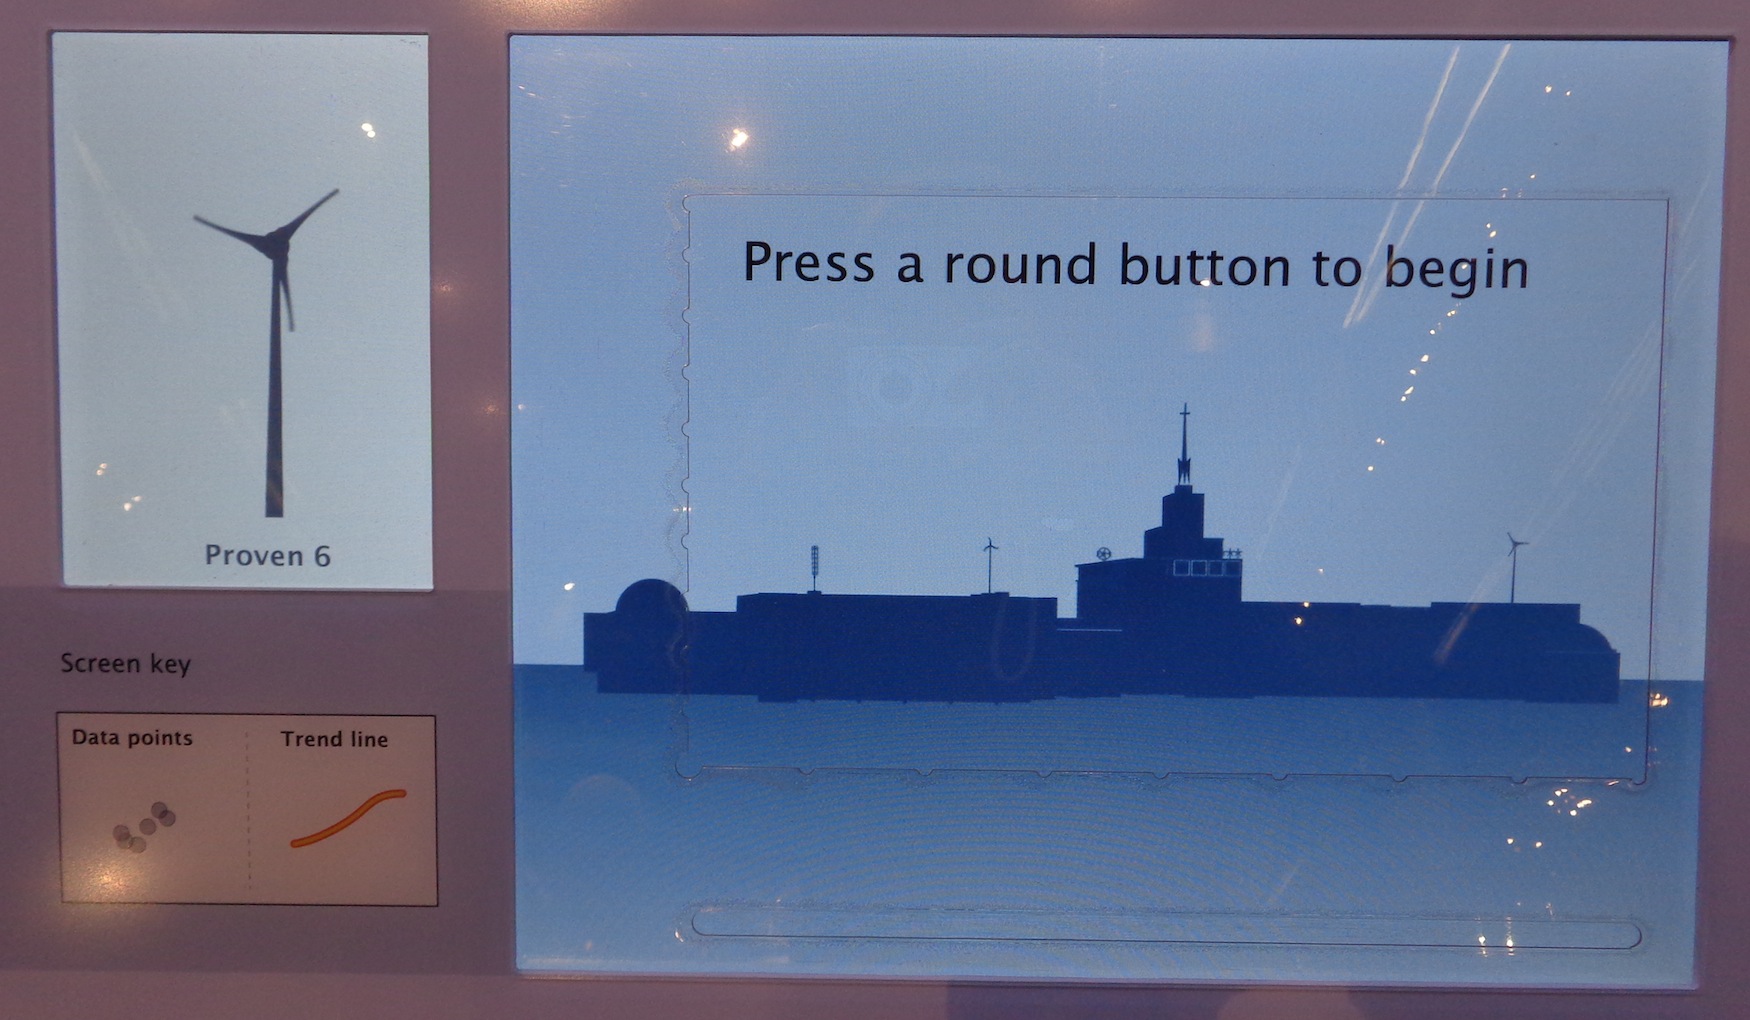
Welcome prompt screen
To begin the activity, a visitor chooses a graph to explore by pressing one of the five round buttons below the computer touch screen. When any one of the buttons is pushed for the first time, a visual and audio introduction to the graph is played. Visitor interaction is limited during the introduction. Once the introduction has concluded, the visitor can then explore the displayed scatterplot graph of power production for that turbine or press another button to view a different graph.
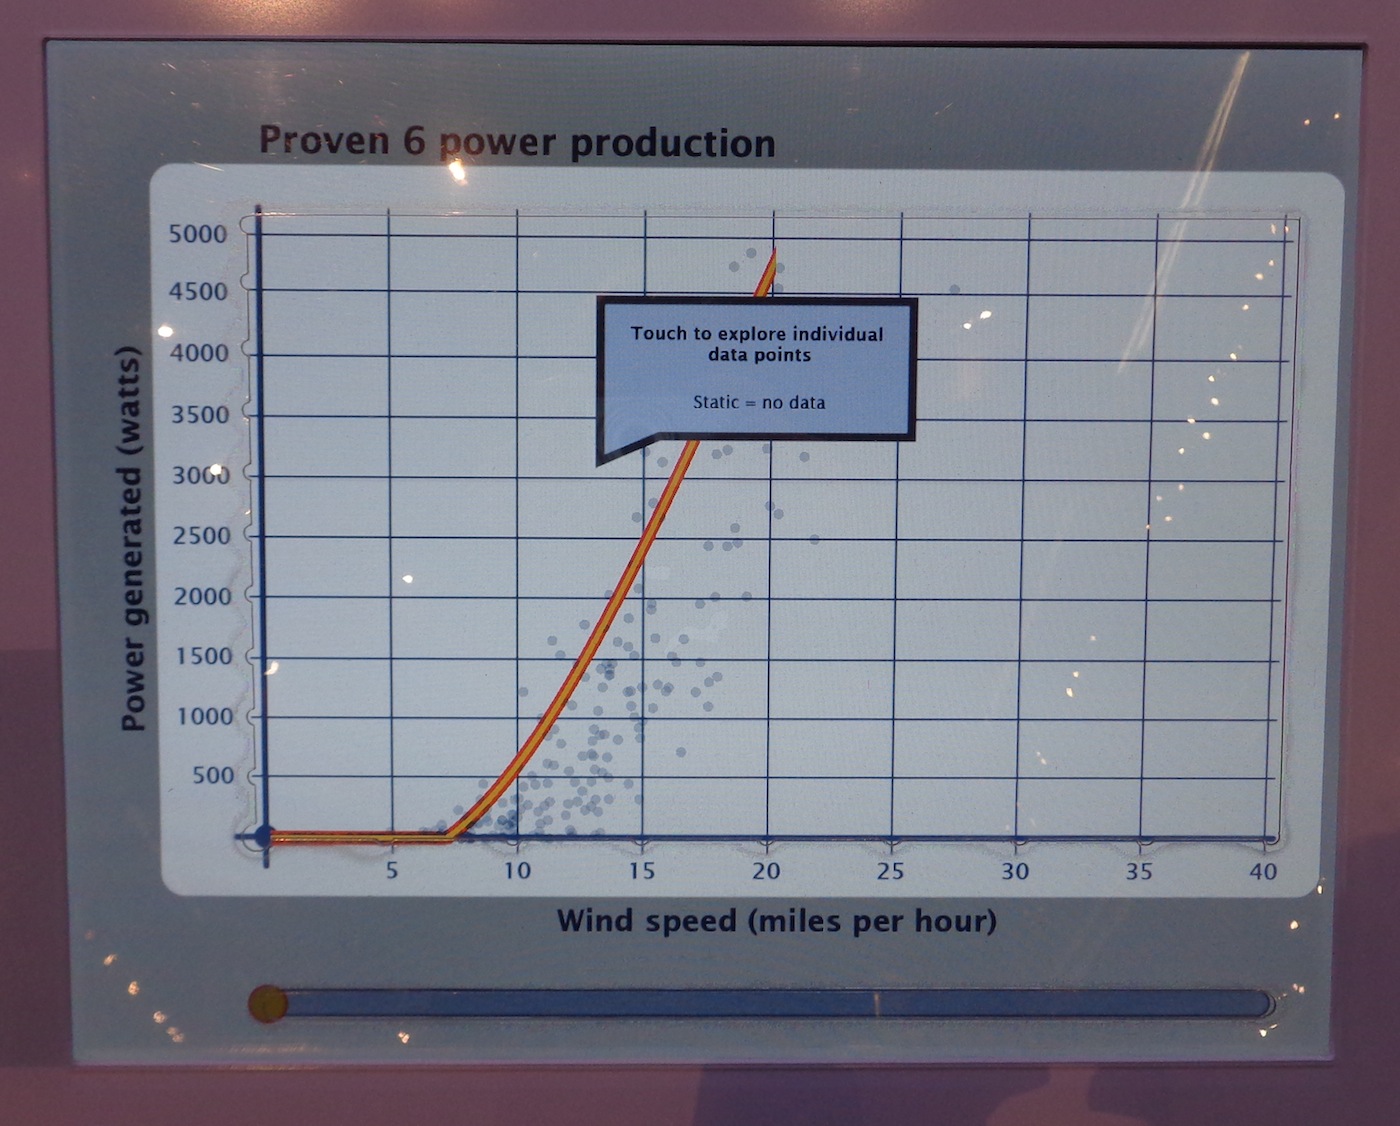
Still from auditory and visual introduction to the graph. Graph area is highlighted. Text within pop-up shown in picture: Touch to explore individual data points, Static = no data
The large rectangular section of exposed computer touch screen has tactile edges with notches that correspond to the axes and grid lines in the scatterplot graphs on the screen. When these are touched, the axes titles and grid line increments are read aloud. Within the graph area, the scatterplot dots are visible and when touched, are articulated by a tone that corresponds with their value. When the visitor touches an area where no data points are present, the visitor hears static. When a visitor holds their finger in one place on the graph, a pop-up text box and audio readout articulate the power produced at that wind speed and how many data points are present in that area of the graph.
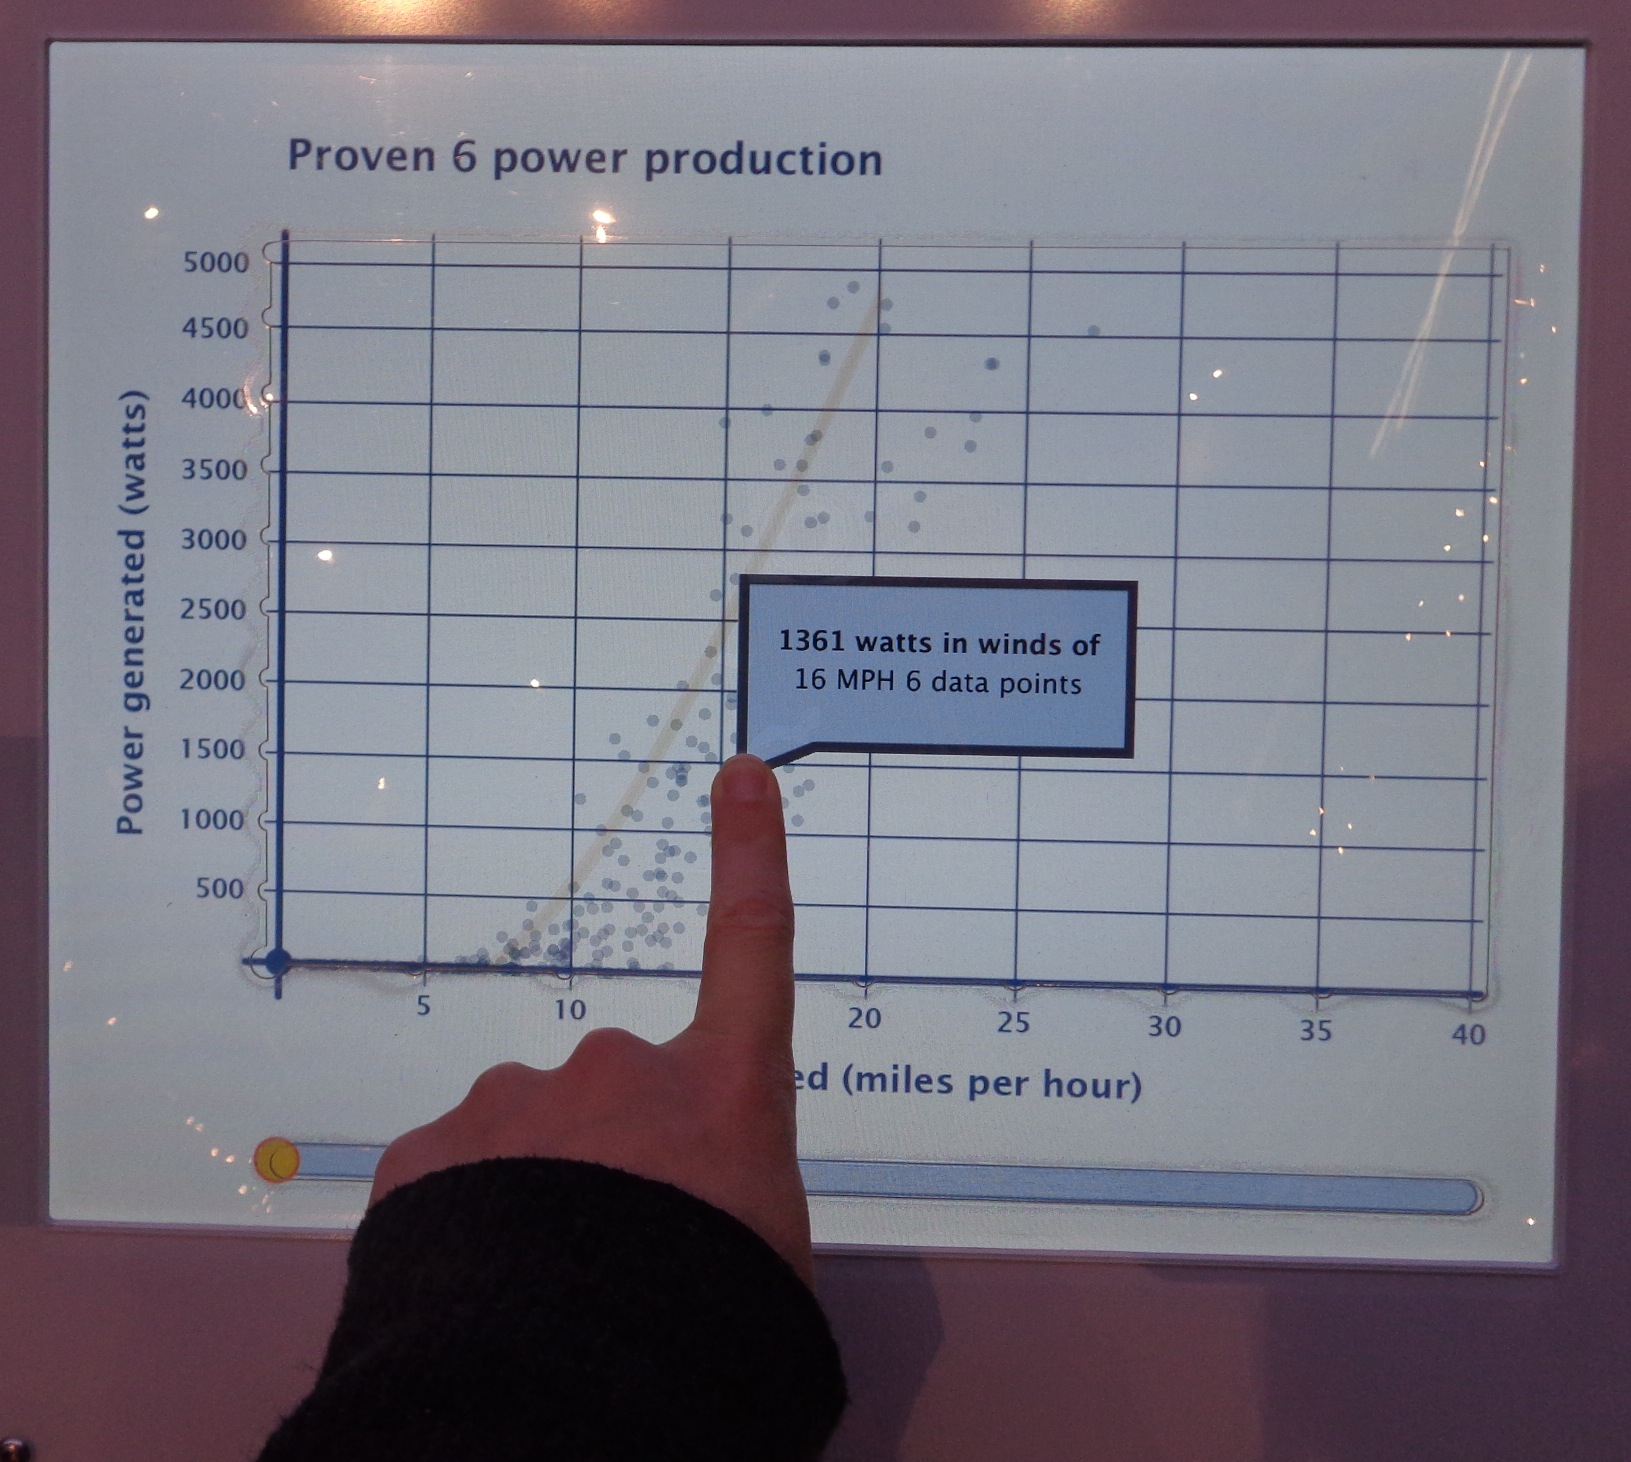
Pop-up text box when visitor holds finger on screen within graph area. Text within pop-up shown in the picture: 1361 watts in winds of 16 MPH 6 data points
Along the bottom edge of the main graph area, there is a small, thin line of exposed computer touch screen. When this is touched, the trend line for the data is sonified, corresponding to the location of the visitor’s finger along the x-axis. If the visitor holds their finger in one place along this trend exploration bar, a text box will pop up and audio verbalizes the average power produced at that wind speed.
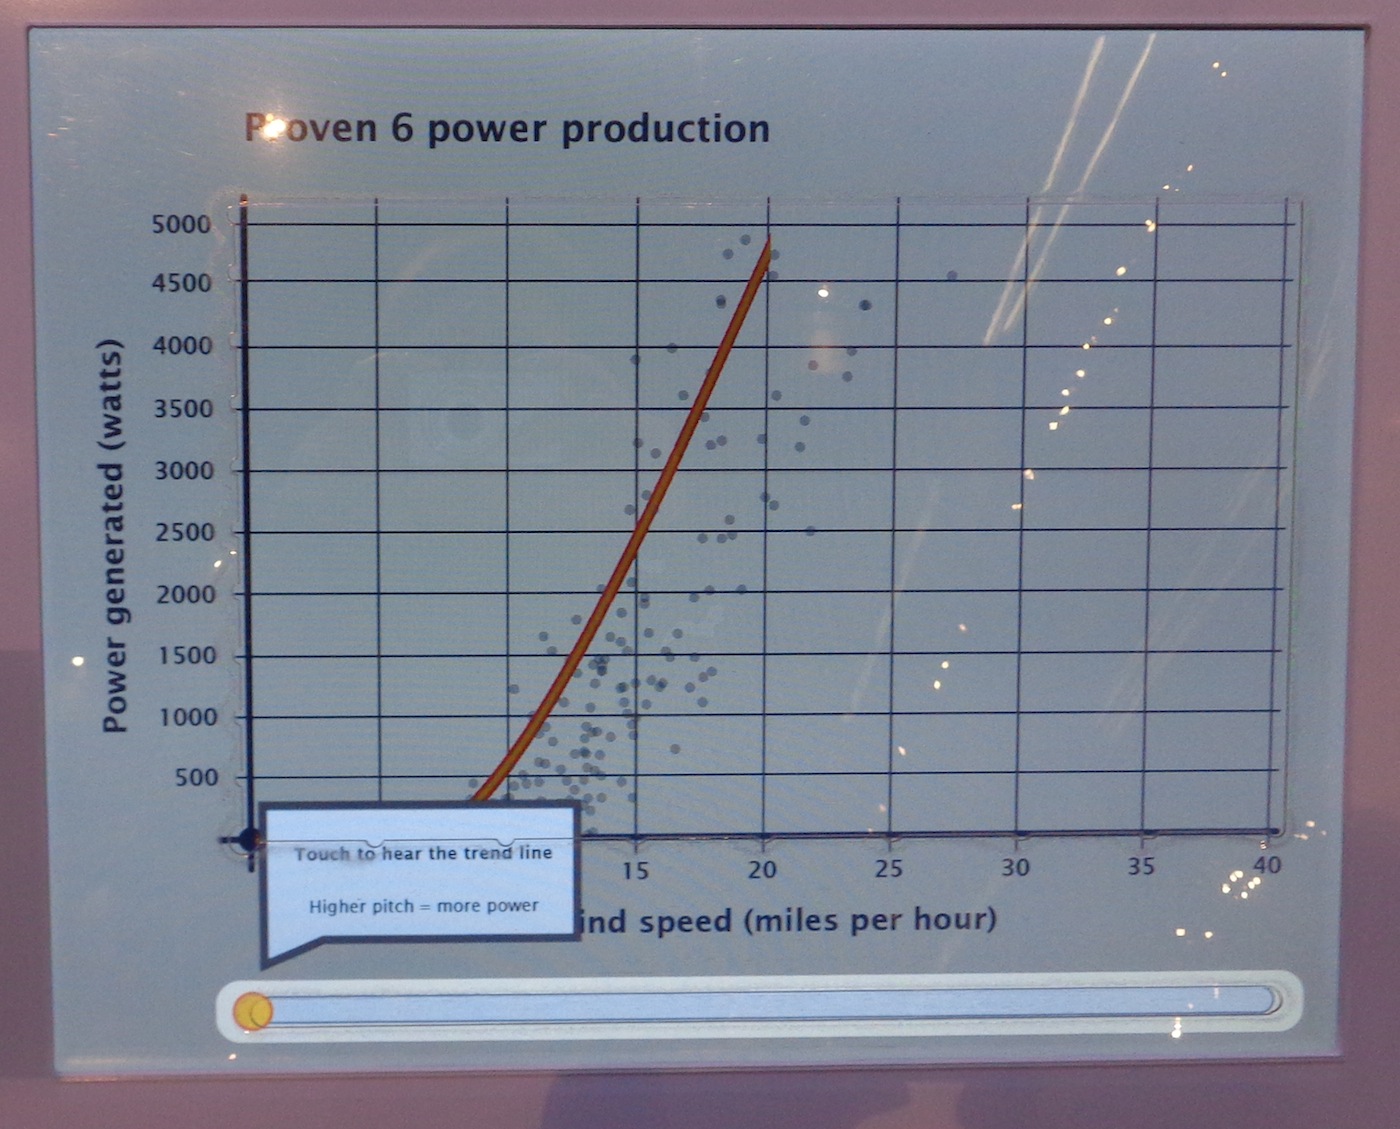
Still from introduction to the graph, highlighting the trend exploration bar below graph area of the screen. Text within pop-up shown in the picture: Touch to hear the trend line, Higher pitch = more power
To the left of the graph screen, there is also an image of the turbine for which the current data is being shown. When this image is touched, audio articulates the image.
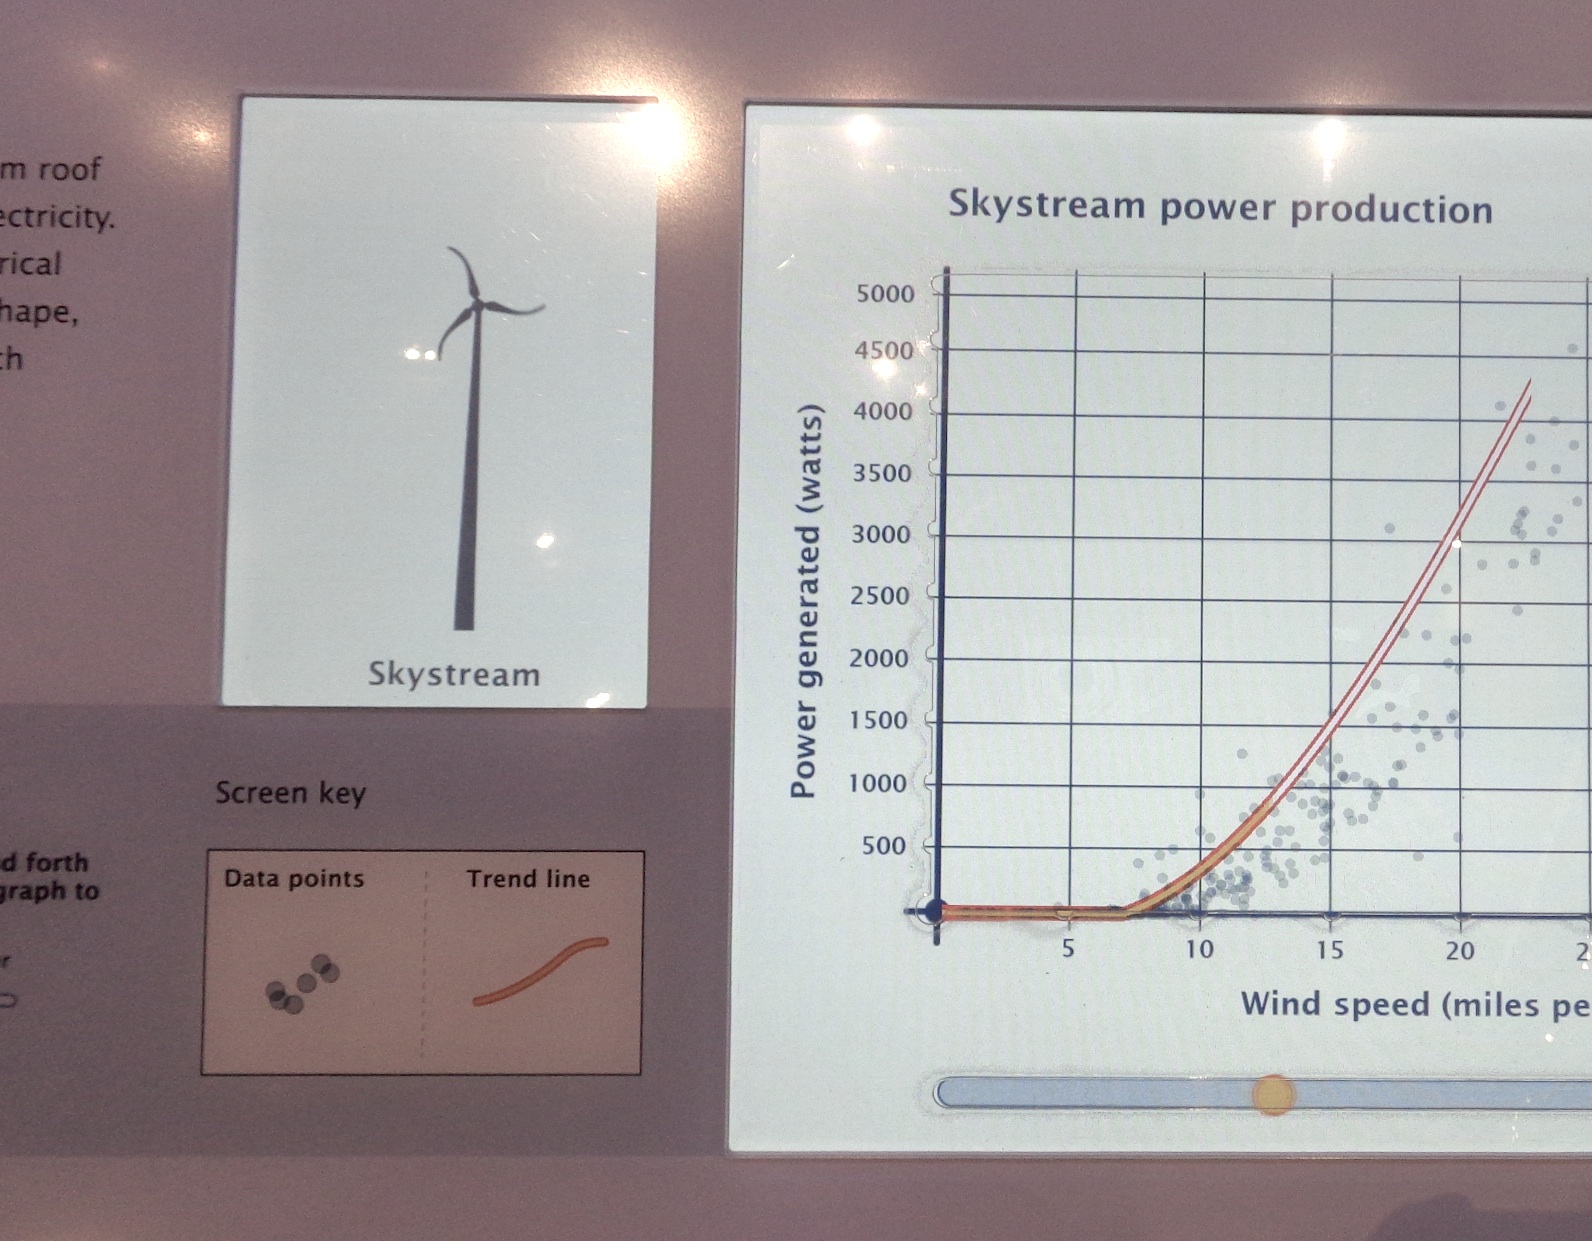
Image of Skystream wind turbine and graph of power production data from that turbine

IMLS Funds New Partnership Between Open Exhibits & Omeka
We are excited to announce a new partnership between The Roy Rosenzweig Center for History and New Media at George Mason University, Ideum (makers of Open Exhibits) and the University of Connecticut’s Digital Media Center.
Our organizations have been awarded a National Leadership Grant for Museums from the Institute of Museum and Library Sciences to extend two open museum platforms: Open Exhibits and Omeka. (A full list of awardees can be found on the IMLS website.)
The project is called Omeka Everywhere. This new initiative will help keep Open Exhibits free and open for the next three years (our NSF Funding ended last month). In addition, a set of new initiatives for Open Exhibits and Omeka are planned. Here is a brief description of the project.
Dramatically increasing the possibilities for visitor access to collections, Omeka Everywhere will offer a simple, cost-effective solution for connecting onsite web content and in-gallery multi-sensory experiences, affordable to museums of all sizes and missions, by capitalizing on the strengths of two successful collections-based open-source software projects: Omeka and Open Exhibits.
Currently, museums are expected to engage with visitors, share content, and offer digitally-enabled experiences everywhere: in the museum, on the Web, and on social media networks. These ever-increasing expectations, from visitors to museum administrators, place a heavy burden on the individuals creating and maintaining these digital experiences. Content experts and museum technologists often become responsible for multiple systems that do not integrate with one another. Within the bounds of tight budget, it is increasingly difficult for institutions to meet visitors’ expectations and to establish a cohesive digital strategy. Omeka Everywhere will provide a solution to these difficulties by developing a set of software packages, including Collections Viewer templates, mobile and touch table applications, and the Heist application, that bring digital collections hosted in Omeka into new spaces, enabling new kinds of visitor interactions.
Omeka Everywhere will expand audiences for museum-focused publicly-funded open source software projects by demonstrating how institutions of all sizes and budgets can implement next-generation computer exhibit elements into current and new exhibition spaces. Streamlining the workflows for creating and sharing digital content with online and onsite visitors, the project will empower smaller museums to rethink what is possible to implement on a shoestring budget. By enabling multi-touch and 3D interactive technologies on the museum floor, museums will reinvigorate interest in their exhibitions by offering on-site visitors unique experiences that connect them with the heart of the institution—their collections.
Multitouch Table Research Findings
A recent addition to our Papers section here on Open Exhibits is worth highlighting here in Open Exhibit blog. Open Exhibits co-PI, Kate Haley Goldman and her colleague Jessica Gonzalez, conducted research at three of our partner museums (Indian Pueblo Cultural Center, The Maxwell Museum of Anthropology, and the New Mexico Museum of Natural History and Science) to better understand how visitors interact with multitouch tables.
Open Exhibits software running on multitouch table at the Maxwell Museum of Anthropology. The Maxwell was one of three museums in which research was conducted. The touch table shown is an Ideum Pro multitouch table.
The research looks at a variety of different aspects concerning visitor interaction including: dwell time, social interaction and a variety of behavioral and verbal indicators. The data suggests that for most visitors the experience is still novel, most visitors (73-82%) to our three partner institutions had not seen a multitouch table before. The stay time was longer for the table, than for any other object found in the gallery spaces. The full report can be found at: OE Multitouch Table Use Findings.
Using Personas to Create Inclusive Digital Exhibit Interactives
The Creating Museum Media for Everyone (CMME) project created personas, or hypothetical archetypes of actual users, to guide the design process of the four prototypes produced during the CMME Workshop. The personas are not real people, but they do represent real people throughout the design process, and are based strictly on real user data.
Personas are useful to design teams because they help ensure user-centered design by representing and communicating user needs to developers. Using real user data discourages potential personal bias on the team. Personas were of particular interest to the CMME team because it was likely that not everyone attending the workshop was familiar with the project’s specific target audience: people with disabilities.
Although personas are useful in the beginning of the design process, they are not meant to take the place of user testing once prototypes are created; therefore, along with using the personas as a tool early on, the CMME team has tested all new prototype iterations with people who have a range of abilities and disabilities.
Persona Creation
The first step in persona creation was reading background literature about how personas can be used and how to create them. Some useful resources are:
The Persona Lifecycle: Keeping People in Mind Throughout Product Design by John Pruitt and Tamara Adlin
Inmates are Running the Asylum: Why High-tech Products Drive us Crazy and How to Restore the Sanity by Allan Cooper
A Web for Everyone: Designing Accessible User Experiences by Sarah Horton and Whitney Quesenbery (See UX Magazine's book excerpt)
User Interface Engineering blog posts:
After reading background literature about persona use and creation, the first step was finding data sources that could provide information on how people with different types of disabilities use exhibits and digital interactives, as well as how these groups experience a museum. The CMME personas were based on data from 11 previous Museum of Science research and evaluation studies.
A bulleted list of characteristics was created for each real person who took part in the research or evaluation study. These characteristics lists contained important and relevant findings from the studies, including traits and qualities of the people, as well as ways in which they used exhibits.
Characteristics lists of all participants were then compared to identify interesting and important distinctions between the people in the sample. Some distinctions that came out of these data were tech savviness, reliance on auditory elements, reliance on visual elements, and reliance on tactile elements. Using the distinctions, scales were created in order to map the real people along a continuum. After each data point was mapped on the continua, patterns began to emerge when the same group of people would fall on the same area of multiple continua (see Figure 1).
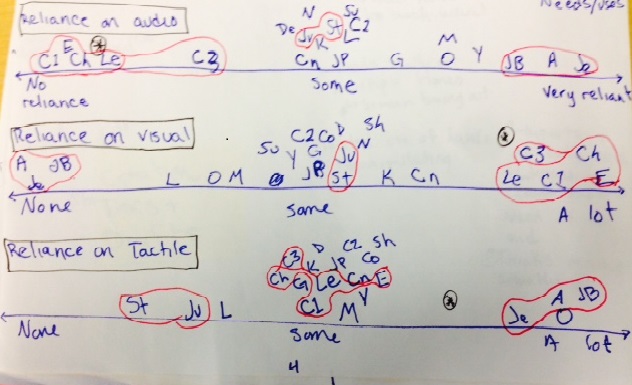 Figure 1: Some of the continua, where each two-letter or letter-number combination represents one person from a research or evaluation study. Groups circled in red show people from the studies that often fell on the same area along the continua.[/caption]
These groupings became the individual personas. Key characteristics of each person in the clump were written down, and then all of the notable traits were combined to create initial drafts of the personas. In this case, key characteristics included difficulties when using exhibits or digital interactives, parts of exhibits or digital interactives that were helpful, attitudes, interests, and familiarity with computers. After some back and forth review with other members of the team, photos were added to the personas, and they were ready to introduce at the CMME Workshop.
Use of personas at the Workshop
The personas were introduced to the participants on the first day of the workshop as a presentation with slides that containing photos and quotes of each persona, along with a description of their characteristics. A paper version of the personas was also included in the participant packets. Large cutouts of the personas heads were created and dispersed on each table as a visual cue to remind participants to think about them during development. Each team was free to use the personas as they saw fit. Here is a summary of how each group used the personas at the workshop:
- Personalization Options Team: This team created a prototype that addressed what personalization might look like at a museum. During development, the team went through each persona and created a personalized experience for them. After their prototype was created, they used a spreadsheet to show each persona going through the personalization path.
- Dynamic Haptic Display Team: This team aimed to create a dynamic haptic representation of a graph. During their design process, the team thought about how each persona would find their individual data point and go about manipulating the data.
- Multi-touch Audio Layer Team: This team set out to create a descriptive audio layer for a multi-touch table. They came up with two plausible options to pursue and went through them with each persona, listing out the pros and cons.
- Data Sonification Team: This team’s goal was to create a prototype that would present data using sound to provide audio cues. This team chose three target personas and pictured these three personas going through and using their prototype.
Click here for more information about the Prototyping Workshop.
According to Kate Haley-Goldman’s evaluation of the workshop, participants found the personas to be highly useful once they were being implemented during development. However, the introduction to the personas could have been stronger, as participants felt that they were introduced quickly during the Possibilities Workshop and then were not mentioned again until the Prototyping Workshop started.
The CMME personas were meant to be a living document, updated as the project progressed. For the formative evaluation, at least 20 visitors with different types of disabilities tested different iterations of the CMME prototypes. The personas were expanded with the knowledge that was gathered from these visitors. Click here to see the current version of the personas.
2014 Cyberlearning Summit

The 2014 Cyberlearning Summit will be June 9-10, 2014 at the University of Wisconsin in Madison, WI. It will feature 15 talks about the latest research on technology and learning, research posters, technology demonstrations and panels.
If you are interested in learning more about the 2014 Cyberlearning Summit visit: http://circlcenter.org/events/
They organizers wanted to ensure everyone that wanted to attend were given the ability to hear the talks. In addition to the Summit in Wisconsin, you may register for a webcast to watch/listen to speakers and optionally chat with other virtual participants. To learn more, visit: http://learningtimesevents.
The speakers come from a wide range of backgrounds from Universities across the United States. They will be collaborating on a variety of topics including the Roles of Teachers in Cyber-enabled Classrooms and Deep Learning. To view the full program, visit: http://circl.sri.com/archive/
Per the Summit website:
The 2014 Cyberlearning Summit will be a gathering of researchers focused on highlighting advances in the design of technology-mediated learning environments, how people learn with technology, and how to use cyberlearning technologies to effectively collect, analyze, and manage data to shed light on learning. The Summit provides a powerful forum for engaging around big ideas and preparing to communicate Cyberlearning impacts to broader audiences. The premier Summit held in January 2012 featuring talks on “big ideas” was highly recognized, and the archived videos of presentations continue to be widely used.